About the series
This article is Part 2 of a three‑part series on quantifying the financial impacts of climate risk.
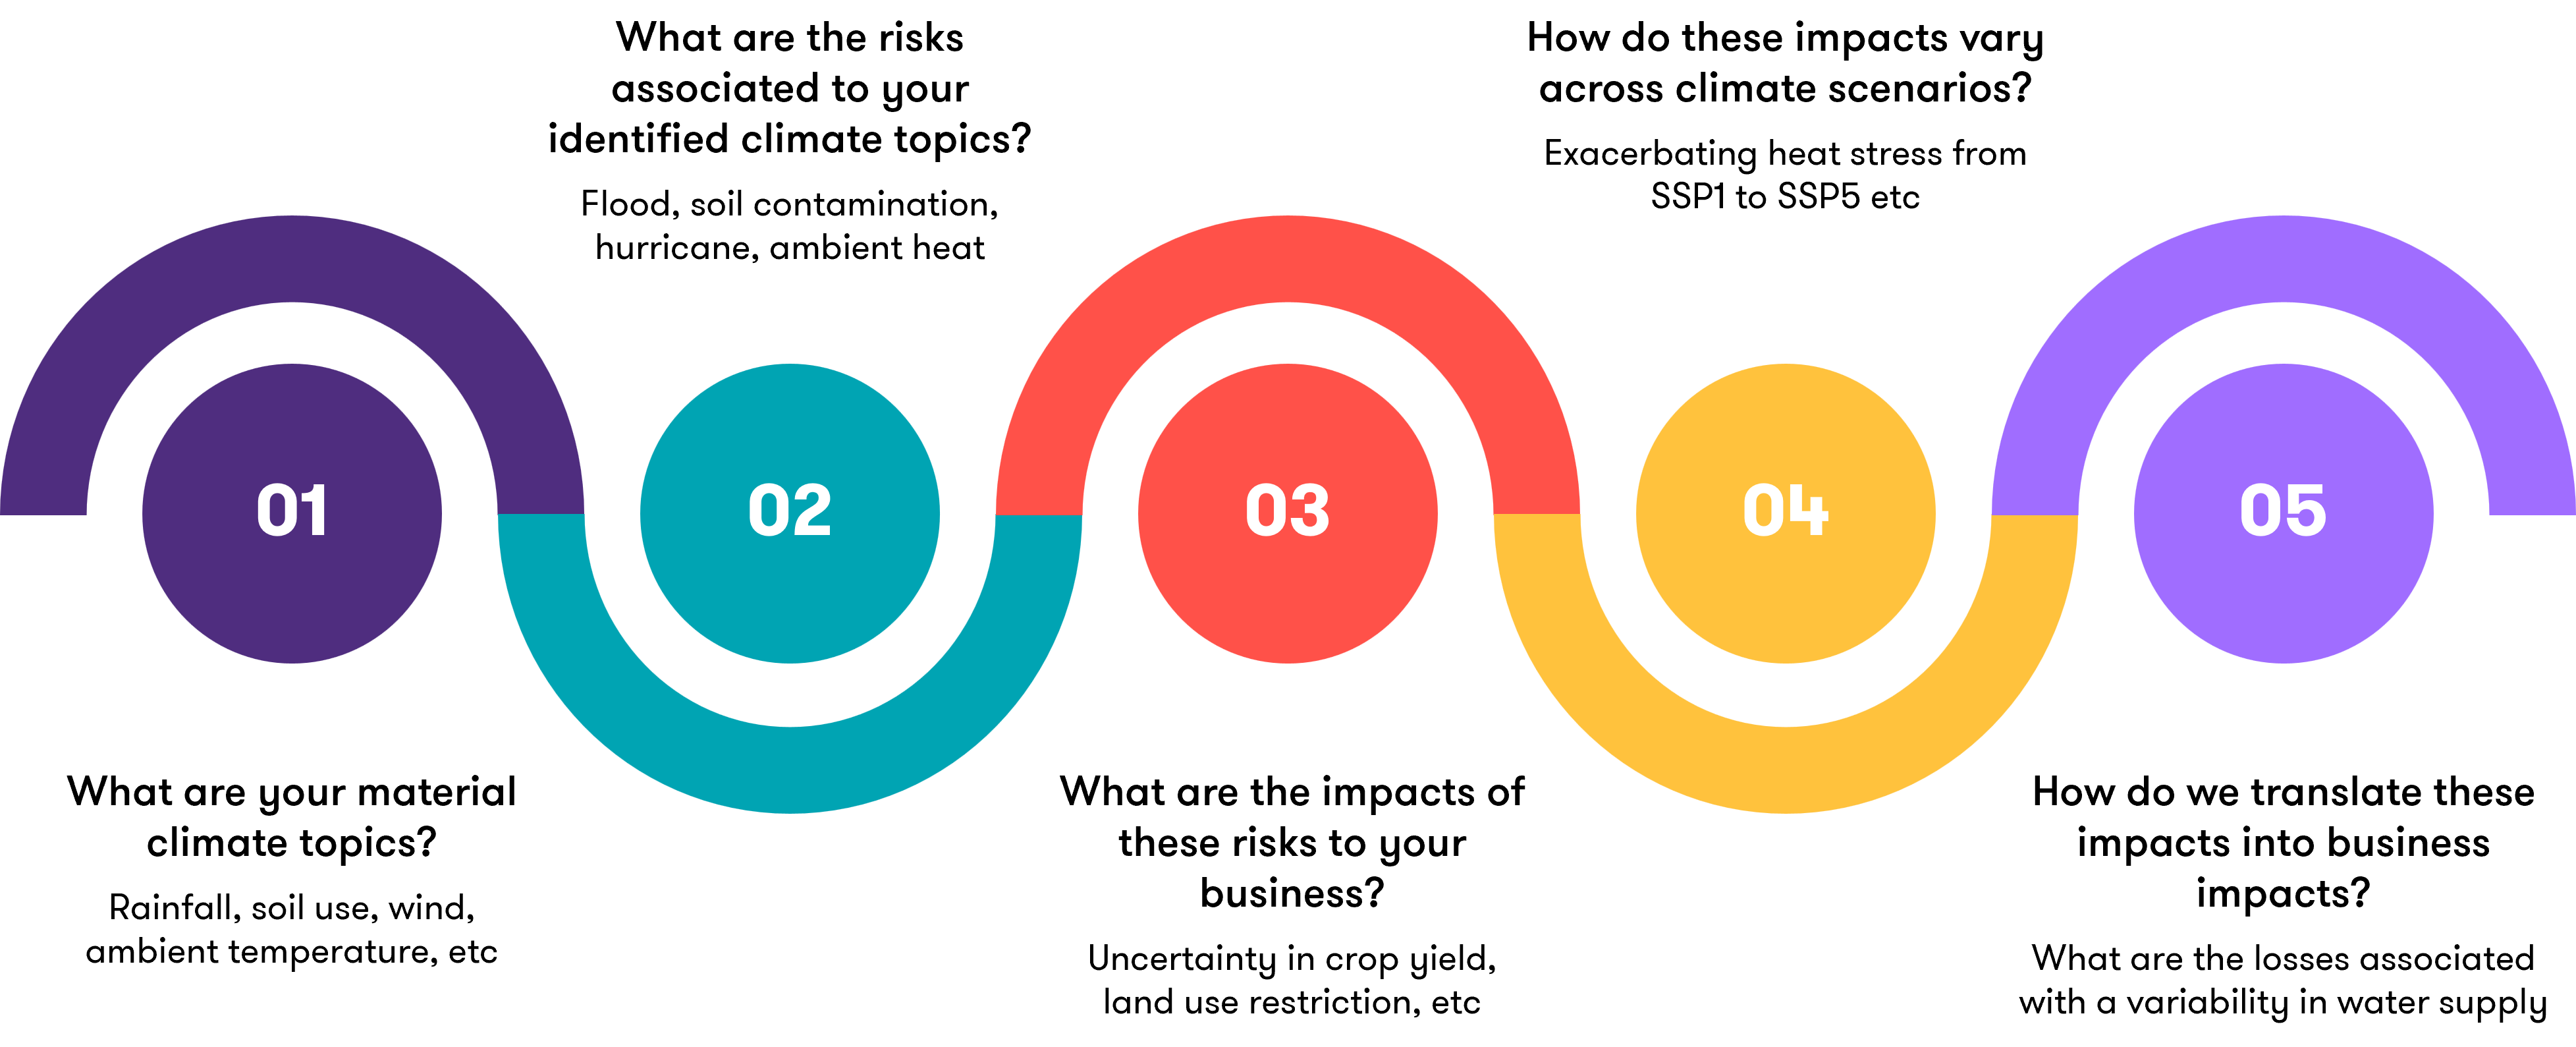
Part 1 focuses on identifying material climate topics and translating risks into business impact pathways.
Part 2 examines how scenario analysis and Expected Value are used to quantify those impacts.
Part 3 walks through a practical illustration, translating climate variability into financial impact step by step using an Expected Value framework.
More from the series
Identifying climate risks and their impact on business performance
How does one start to quantify climate risk?
![]()
Step 4: How do these impacts vary across climate scenarios?
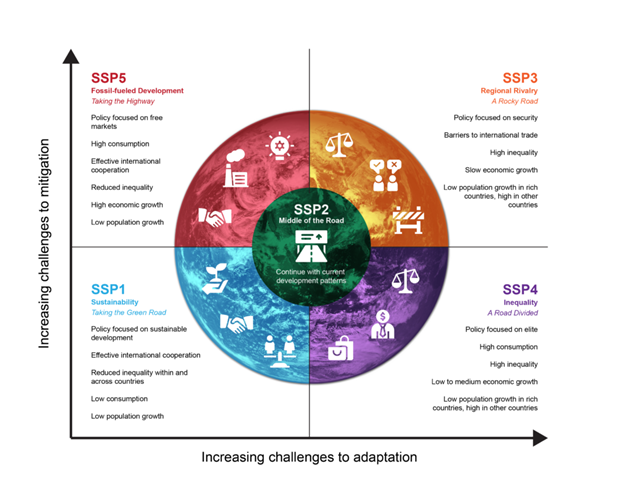
Companies should utilise recognised climate scenario frameworks when assessing climate-related risks and opportunities. The most widely used are those developed by the Intergovernmental Panel on Climate Change (IPCC), including pathways such as SSP1-2.6 through to SSP5-8.5, which provide a foundational set of socio-economic and emissions trajectories.
These can be, but not required, complemented by more specialised frameworks, such as those developed by the Network for Greening the Financial System (NGFS), commonly used in financial risk analysis, and the International Energy Agency (IEA), which provides detailed energy sector transition scenarios.
Together, these scenarios describe a range of plausible future states shaped by differing levels of emissions, policy ambition and socio-economic development. They enable organisations to assess how the likelihood and severity of climate-related risks may evolve over time, recognising that impacts are often region- and hazard-specific.
![]()
Depending on the scenario, both the likelihood and severity of business impacts will vary. Higher emissions SSP pathways, along with the accompany climate data sets such as Singapore National Climate Change Study V3, generally increase both impact frequency and intensity of hazards, as adaptation and mitigation become more challenging.
|
Material climate topic |
How the farming business is impacted (impact pathway) |
SSP1 (Sustainability / lower emissions) |
SSP3 (Regional rivalry / fragmented, high challenges) |
SSP5 (Fossil fuelled / highest emissions) |
|
ASEAN traditional farm
|
Water stewardship and availability management
|
Water reliability drives irrigation stability → yield consistency → revenue predictability. Drier spells and rainfall variability increase cost of water access/storage and reduce planted‑area reliability.
|
Medium: Physical stress rises but moderated; more orderly adaptation and planning reduce disruption.
|
High: Physical stress plus constrained coordination/technology diffusion increases operational disruption and cost volatility.
|
Very high: Highest climate load amplifies drought/rainfall variability → most pressure on irrigation costs and yield stability.
|
|
Climate-resilient crop and varietal selection
|
Shifting temperature/rainfall changes crop suitability → replanting cycles, R&D/seed costs, yield volatility, longer payback for varietal changes.
|
Medium: Transition can be planned; lower warming reduces rate of suitability loss.
|
High: Fragmented support and slower technology transfer raise adaptation cost and lag risk.
|
Very high: Rapid and severe warming accelerates variety obsolescence; higher spend needed to maintain yields.
|
|
Singapore vertical farm
|
Energy efficiency of controlled environments
|
Higher ambient heat → higher cooling load → higher electricity consumption → margin compression in an energy intensive model.
|
High (but manageable): Heat stress rises; energy burden increases but lower than SSP5; efficiency upgrades are more effective over time.
|
High: Heat stress rises and system level constraints may be harder to resolve under fragmented pathways.
|
Very high: Largest structural cooling burden and operating cost pressure.
|
|
Reliable low-carbon electricity sourcing
|
Dependence on grid power → exposure to electricity price volatility, carbon intensity and future carbon related costs → competitiveness and investment returns.
|
Medium: Faster decarbonisation and clearer policy reduce carbon cost shocks; electricity remains material but more predictable.
|
High: Fragmented transition can mean more uneven price signals and reliability concerns, raising long run cost uncertainty.
|
High–Very high: Greater risk of abrupt cost adjustments; energy remains dominant cost driver.
|
Step 5: How do we translate these impacts into business impacts?
In practice, risks are managed by weighing likelihood against impact. Climate risk is no different, and this is typically summarised in a scenario‑based risk table.
| Business / material climate topic |
Impact pathway |
SSP1 – Lower-emissions pathway: estimated business impact likelihood and impact intensity |
SSP3 – Fragmented pathway: estimated business impact likelihood and impact intensity |
SSP5 – High-emissions pathway: estimated business impact likelihood and impact intensity |
|
ASEAN traditional farm – Water stewardship and availability management
|
Water reliability drives irrigation stability → yield consistency → revenue predictability. Drier spells and rainfall variability increase the cost of water access/storage and reduce reliability of planted acreage.
|
Estimated likelihood of material business impact over 10 years: 40–55% (based on company translation of regional hazard-frequency data into business impact likelihood).
Impact intensity if materialised: Moderate. A multi-country farm group with USD 120m annual revenue faces a two-season rainfall deficit affecting 35% of acreage. Yield declines 8–12% on affected acreage, resulting in USD 4.0–6.0m lost revenue. Mitigation measures, including temporary pumping, water trucking, overtime irrigation and agronomy interventions, add USD 1.0–1.5m.
Estimated financial impact: USD 5.0–7.5m, equivalent to ~4–6% of annual revenue.
Illustrative expected value: USD 2.0–4.1m.
|
Estimated likelihood of material business impact over 10 years: 60–75% (higher hazard frequency and weaker adaptation conditions increase business impact likelihood).
Impact intensity if materialised: High. Water shortfalls are more persistent and harder to offset due to slower technology diffusion and weaker cross-border coordination. A comparable two-season shortfall affects 45% of acreage, with 12–18% yield decline on affected acreage, resulting in USD 6.5–9.5m revenue loss. Higher contingency spending for water access and infrastructure workarounds adds USD 2.0–3.0m.
Estimated financial impact: USD 8.5–12.5m, equivalent to ~7–10% of annual revenue.
Illustrative expected value: USD 5.1–9.4m.
|
Estimated likelihood of material business impact over 10 years: 75–90% (higher emissions pathway increases hazard intensity/frequency; business likelihood depends on exposure and adaptation capacity).
Impact intensity if materialised: Very high. Higher emissions conditions intensify dry spells and rainfall variability, increasing irrigation stress. In a severe two-season sequence, 50% of acreage is affected. Yield declines 18–25% on affected acreage, resulting in USD 10–15m revenue loss. Emergency water sourcing and accelerated capex, including reservoir expansion, irrigation redesign and drought-resilient upgrades, add USD 3–5m.
Estimated financial impact: USD 13–20m, equivalent to ~11–17% of annual revenue.
Illustrative expected value: USD 9.8–18.0m.
|
|
Singapore vertical farm – Energy efficiency of controlled environments
|
Higher ambient heat → higher cooling load → higher electricity consumption → margin compression in an energy-intensive model.
|
Estimated likelihood of material business impact over 10 years: 30–45% (derived from projected heat-related hazard frequency and company-specific cooling sensitivity).
Impact intensity if materialised: Moderate to high. A vertical farm with SGD 25m annual revenue and SGD 6m annual electricity cost sees sustained higher cooling demand, combined with moderate price pressure. Net electricity costs rise 10–15%, resulting in SGD 0.6–0.9m annual OPEX increase. If EBITDA margin is 12%, this cuts EBITDA by ~2–4 percentage points unless offset by efficiency improvements.
Estimated financial impact: SGD 0.6–0.9m per year.
Illustrative expected value: SGD 0.18–0.41m per year.
|
Estimated likelihood of material business impact over 10 years: 45–60% (higher heat stress and less favourable system conditions increase operating sensitivity).
Impact intensity if materialised: High. Heat stress increases and wider system constraints make efficiency gains slower to realise. Electricity costs rise 15–25%, due to higher cooling runtime and less favourable price dynamics. This results in SGD 0.9–1.5m annual OPEX increase. Short, episodic downtime and wastage could add SGD 0.2–0.4m equivalent impact.
Estimated financial impact: SGD 1.1–1.9m per year in a bad year.
Illustrative expected value: SGD 0.50–1.14m per year.
|
Estimated likelihood of material business impact over 10 years: 60–75% (higher emissions conditions increase cooling-load stress; actual business impact depends on facility design, energy contracts and resilience measures).
Impact intensity if materialised: Very high. V3-style heat stress escalation is most severe under high-emissions conditions, driving structurally higher cooling loads. Electricity costs rise 20–35%, resulting in SGD 1.2–2.1m annual OPEX increase. If the farm requires an unplanned cooling retrofit earlier than expected, an additional SGD 1.5–3.0m one-off capex shock may arise, with depreciation or finance costs thereafter.
Estimated financial impact: SGD 1.2–2.1m per year, plus potential SGD 1.5–3.0m capex shock.
Illustrative expected value: SGD 0.72–1.58m per year, excluding capex; higher if retrofit capex is probability-weighted.
|
For illustrative purposes, the table above provides a hypothetical, scenario‑based quantification of climate risk across different climate futures (SSP1, SSP3 and SSP5), showing (i) the likelihood of a material business impact over a 10‑year horizon and (ii) illustrative financial consequences if the risk materialises.
How to use the quantification table above
In practice, the table is typically used for internal management reporting to assess a company’s financial exposure to climate risk, or as part of external sustainability disclosures – particularly those aligned with ISSB requirements.
The table traces a clear impact pathway from climate drivers (such as rainfall variability and rising ambient temperatures), through operational effects (including reduced irrigation reliability, yield volatility, or higher energy demand), and ultimately to financial outcomes, such as revenue loss, cost escalation, and potential capital expenditure. By structuring the analysis across progressively more challenging climate scenarios, the table illustrates how both the frequency and magnitude of impacts increase under higher‑emissions pathways. Do note that the numbers presented in the table are purely for illustration purposes and are not intended to be representative of reality.
This approach provides a decision‑useful view of downside exposure under different climate conditions.
So how do we estimate the financial impact of climate risk?
As shown above, climate risk (both physical and transition) can be quantified using an Expected Value (EV) framework:
Expected Value = Probability of business impact × Financial impact
The Expected Value (EV) framework combines likelihood and impact to produce a single, decision‑useful estimate over time.
This enables consistent comparison and prioritisation, supporting capital allocation under uncertainty.
The EV framework requires two key inputs:
1. Probability of business impact
Unlike many operational risks, climate risks and their business impacts cannot be assessed using historical data alone. Instead, organisations infer business‑impact likelihood by combining inputs such as climate projections and historical trends.
- Climate projections (e.g. IPCC scenarios, national climate studies such as Singapore Climate Projections V3)
- Historical trends
IPCC scenarios are not probabilistic forecasts; they provide directional “what‑if” pathways. Probabilities are therefore applied to business impacts, not to the scenarios themselves.
Companies should treat scenarios as stress tests: “If the climate evolves in this way, what does it mean for our operations, assets, costs and revenues?”
While IPCC scenarios are not assigned probabilities, they provide robust directional signals (e.g. hotter conditions, heavier rainfall, longer dry spells). Organisations can translate these into business‑impact likelihoods by considering (i) signal strength, (ii) exposure and sensitivity, and (iii) relevant planning horizons. In this framework, probabilities apply to business impacts, not to the scenarios themselves.
Directional signals (e.g. more frequent heat stress) can be translated into probability bands (low/medium/high) based on signal strength, exposure and sensitivity.
- Strength of the climate signal
- Degree of exposure
- Sensitivity of the business
2. Financial value of impact
Financial impact is typically estimated in a manner similar to corporate planning and stress‑testing, assessing how different climate conditions could affect operations and financial performance over time.
This process generally involves several structured steps:
![]()
Limitation of the Expected Value framework
While the EV framework is a useful starting point for prioritisation and capital allocation, climate risks are characterised by fat‑tailed distributions, non‑linear damage functions, and the potential for compounding and cascading impacts. As a result, relying on point‑estimate EVs alone risks materially understating downside exposure.
In practice, EV‑based assessments should be complemented by explicit consideration of tail outcomes, stress scenarios, and loss amplification mechanisms. This can be achieved by incorporating asymmetric probability weightings, modelling impact escalation beyond critical thresholds, and evaluating outcomes across severe but plausible scenarios rather than around a single mean.
Such an approach preserves the intuitive appeal of EV while ensuring that planning and risk responses are calibrated to the full distribution of outcomes, particularly for low‑probability, high‑severity events that can disproportionately affect financial performance and resilience.
Key takeaways
As increasing capital and effort are directed toward new sustainable industries, as well as the sustainable transformation of traditional sectors, investors are seeking greater clarity on the climate‑risk exposure of their investee companies and assets. At the same time, regulators are progressively requiring companies to disclose their exposure to climate‑related risks and to articulate how these risks are being addressed – whether through avoidance, mitigation, adaptation measures or others.
This represents a significant undertaking. It requires the integration of skillsets that do not typically coexist: an understanding of climate science, and the ability to translate climate‑related hazards into meaningful financial and business impacts.
Adding further complexity, while the EV framework provides a broadly applicable foundation, the quantification of climate risks is not uniform across risk types. As illustrated in this paper, different hazards – such as ambient heat, wind, or rainfall – require distinct approaches to risk quantification.
Read the next part of the series
In Part 3, we walk through a practical illustration, translating climate variability into financial impact step by step using an Expected Value framework.
More from the series
An illustration: Translating climate risk into financial outcomes