About the series
This article is Part 1 of a three‑part series on quantifying the financial impacts of climate risk.
Part 1 focuses on identifying material climate topics and translating risks into business impact pathways.
Part 2 examines how scenario analysis and Expected Value are used to quantify those impacts.
Part 3 walks through a practical illustration, translating climate variability into financial impact step by step using an Expected Value framework.
Climate risk is financial risk – there is no other way to spin the story
Every extreme weather event carries a cost – directly or indirectly. For many, the impact is relatively minor, such as travel delays or temporary disruption, but these effects still represent real economic and social costs.
For those less fortunate, the consequences can be far more severe, ranging from minor disruption to the complete write‑off of assets. Destroying lives and livelihoods.
However, climate risk is not solely about damages and losses; the ability to mitigate, adapt to, or avoid climate risks also creates climate‑related opportunities. According to the Climate Policy Initiative (CPI), it was estimated that investments into global climate finance came in at approximately USD 1.5 trillion in 2022 and USD 1.9 trillion in 2023. This scale of investment mirrors the growth in sustainable and green funds, where assets under management expanded from well under USD 1 trillion in 2016 to approximately USD 3.9 trillion by the end of 2025 – a compound annual growth rate (CAGR) of nearly 20% over the last 9 years!
With significant risks and opportunities at stake, stakeholders increasingly expect asset owners to be transparent about climate‑related exposures.
Why quantifications matter – the old adage of “you cannot change what you don’t monitor”
The push from within to be better…
As with any form of risk management, the decision of how to manage those risks depend on the magnitude of impact. Without quantification, organisations risk under‑preparing or over‑investing in misaligned responses.
Quantification enables the integration of climate risk into financial planning and capital allocation. It also supports more effective investment prioritisation, particularly as climate-related investments typically require significant upfront capital and involve long payback periods.
Finally, quantification strengthens organisational resilience by enabling organisations to anticipate change and respond effectively, rather than reacting under pressure.
The pull from regulators and investors…
Quantifying climate risk remains challenging, requiring both climate science literacy and financial analysis – capabilities that are still developing within many organisations.
At the same time, investor expectations are rising. As capital flows into sustainable assets, stakeholders increasingly demand transparency around climate-related risks. Over time, initiatives such as the Carbon Disclosure Project (CDP), the Task Force on Climate-related Financial Disclosures (TCFD), and more recently the International Sustainability Standards Board (ISSB) have aimed to improve the quality and consistency of disclosures – particularly disclosures that are decision-useful for financial stakeholders.
What began as largely voluntary, activist‑driven initiatives has increasingly been embedded within regulatory frameworks.
In Singapore, this evolution has been progressive. The Singapore Exchange (SGX) introduced sustainability reporting in 2016 on a “comply or explain” basis. Climate‑related disclosures aligned with the TCFD were subsequently mandated from FY2022 on a “comply or explain” basis for all issuers, before transitioning to mandatory requirements for selected industries in FY2023 and FY2024. In March 2024, SGX RegCo adopted the ISSB standards, following their endorsement by the Accounting and Corporate Regulatory Authority (ACRA) on 28 February 2024.
Some executives question the urgency given Singapore’s relative insulation from certain physical climate risks; however, many Singapore‑listed companies operate regionally and are exposed to diverse climate risks across Asia.
Climate disclosure is therefore not merely a compliance exercise. It is essential for maintaining transparency, investor confidence, and efficient capital allocation in an increasingly climate-exposed global economy.
How does one start to quantify climate risk?
![]()
Step 1: What are your material climate topics?
The first step is awareness. Companies should assess which climate topics are relevant based on what they do, how they operate, and where they operate.
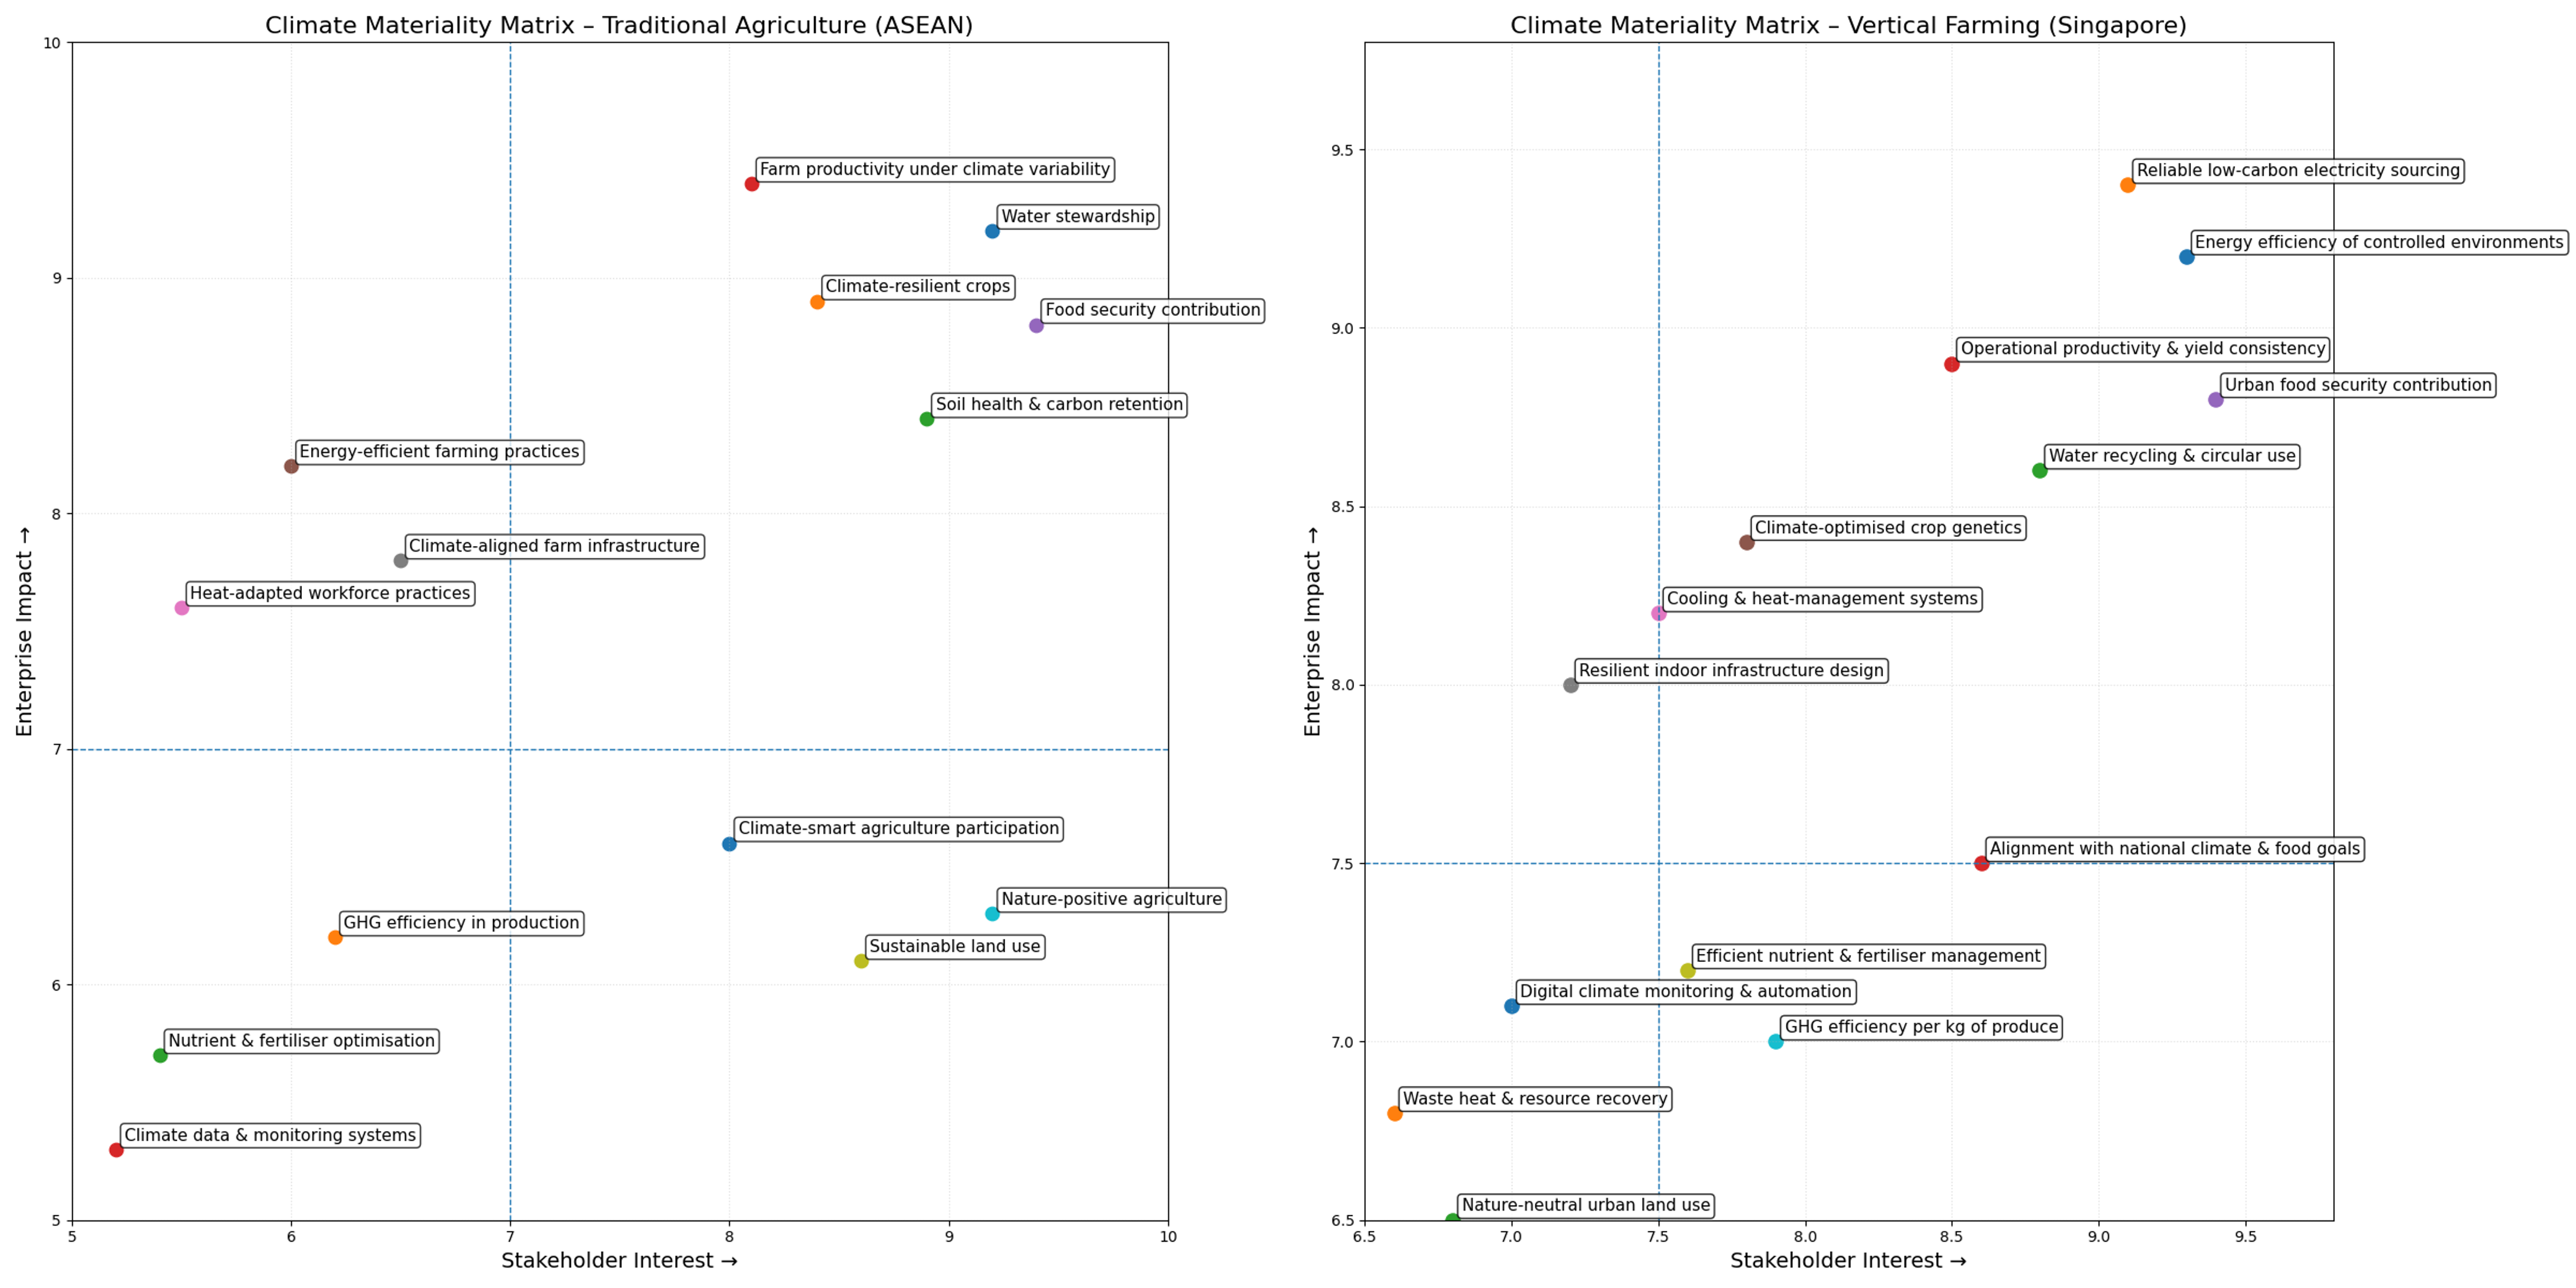
For example, a vertical farm in Singapore faces a very different risk profile compared to traditional farms elsewhere. While both operate in agriculture, their exposure to climate differs significantly.
Traditional farms are directly influenced by weather patterns, making water availability, soil health, and climate variability highly material. In contrast, vertical farms operate in controlled environments, shifting materiality toward energy use, infrastructure efficiency, and system reliability.
This illustrates a key principle: climate materiality is not sector‑wide, but highly dependent on business model and geography.
Generally, a climate materiality matrix can be developed via either through one or a combination of the below techniques:
- At the minimum, a climate materiality matric can be developed using internal expert judgement, where department heads and / or management teams assess climate topics based on their operational knowledge, financial exposure, and strategic priorities.
- Organisations can also construct one through broad stakeholder engagement, incorporating perspectives from investors, customers, regulators, employees, and supply chain partners to capture external expectations and perceived importance.
- For a more robust outcome, organisations may adopt a hybrid approach – starting with an internally generated long list of climate topics and preliminary scoring, and then refining and prioritising these through structured stakeholder consultations (e.g. surveys, interviews, or workshops). This combined method ensures that the matrix reflects both enterprise-level impact and stakeholder relevance, resulting in a more balanced, defensible, and decision-useful output.
![]()
Step 2: What are the risks associated to your identified climate topics?
Once material topics are identified, the next step is to map risks to each topic, recognising that different operating environments create fundamentally different risk exposures. Material climate topics can be such as rainfall, temperature, wind, or sea-level rise.
Once these topics are defined, the organisation can systematically associate specific risks to each topic by considering how changes in those climatic variables translate into tangible business impacts. For example, heightened rainfall intensity may give rise to flooding risks, while increased temperatures may drive heat stress, asset degradation, or higher cooling costs.
This approach helps anchor risk identification in physical climate realities rather than generic risk lists, ensuring that each identified risk is directly traceable to a material climate driver.
By structuring the process in this way, management can build a more coherent and defensible linkage between climate science and business impacts, which in turn supports more robust scenario analysis, risk quantification, and mitigation planning.
Step 3: What are the impacts of these risks to your business?
Each identified risk must be translated into operational and financial impacts, with clear impact pathways linking climate drivers to revenue, cost, and capital outcomes.
For traditional farms, rainfall variability associated to drought or flood will affect crop yields and revenue stability. For vertical farms, energy cost volatility directly impacts margins.
The key is to establish clear impact pathways, linking climate drivers to financial outcomes such as revenue loss, cost increases, or capital expenditure requirements.
|
Material climate topic |
Climate risk mapped to the topic |
How the farming business is impacted |
|
Traditional farm
|
Water stewardship and availability management
|
Increased rainfall variability, prolonged dry spells, and altered monsoon timing reduce water reliability, raising exposure to production shortfalls and irrigation constraints.
|
Uncertainty in irrigation availability leads to fluctuating yields, higher water management costs, and reduced ability to plan planting cycles, undermining revenue predictability.
|
|
Climate-resilient crop and varietal selection
|
Rising temperatures and shifting precipitation patterns can render existing crop varieties less suitable, increasing yield volatility and replanting or transition costs.
|
Farming operations face declining productivity unless crop portfolios are adapted, increasing transition costs and lengthening payback periods for new varietals.
|
|
Soil health and carbon retention practices
|
More frequent flooding, drought, and heat stress accelerate soil degradation and organic matter loss, undermining long term land productivity and increasing restoration costs.
|
Long-term land productivity declines, requiring higher input use, land restoration investments, or relocation of operations, increasing capital intensity.
|
|
Farm productivity under climate variability
|
Greater frequency and intensity of extreme weather events disrupt planting, harvesting, and logistics, creating revenue volatility and higher operating risk.
|
Output volatility increases earnings variability, weakens supply commitments, and raises working capital and insurance requirements.
|
|
Food security contribution across operating regions
|
Climate driven production shocks can reduce regional supply reliability, exposing the business to market volatility, export controls, and policy intervention during shortages.
|
Market volatility and regulatory responses (e.g. export controls, price stabilisation) affect pricing power, margins, and access to key markets.
|
|
Singapore vertical farms
|
Energy efficiency of controlled environments
|
Rising ambient temperatures increase cooling and lighting demand, heightening exposure to operating cost escalation in an energy intensive production model.
|
Operating costs rise in an energy intensive model, directly compressing margins unless offset by productivity or efficiency gains.
|
|
Reliable low carbon electricity sourcing
|
Dependence on grid electricity exposes operations to carbon intensity changes, electricity price volatility, and potential future carbon pricing or energy related regulation.
|
Cost of production becomes sensitive to energy market dynamics, affecting long term competitiveness and investment returns.
|
|
Operational productivity and yield consistency
|
Climate driven stress on energy systems (e.g. heat waves increasing grid load) can affect uptime, system stability, and production consistency.
|
Any disruption to power or cooling systems can immediately halt production, impacting output consistency and customer supply commitments.
|
|
Urban food security contribution
|
Climate-related disruptions to energy or cooling systems could constrain local production at precisely the time when import reliant supply chains are most exposed.
|
Reduced reliability of local supply undermines the strategic role of vertical farms in enhancing food resilience and weakens policy and stakeholder support.
|
Read the next part of the series
In Part 2, we show how these impact pathways are translated into scenario‑based probabilities and financial outcomes using an Expected Value framework.
More from the series
Quantifying the financial impacts of climate risk